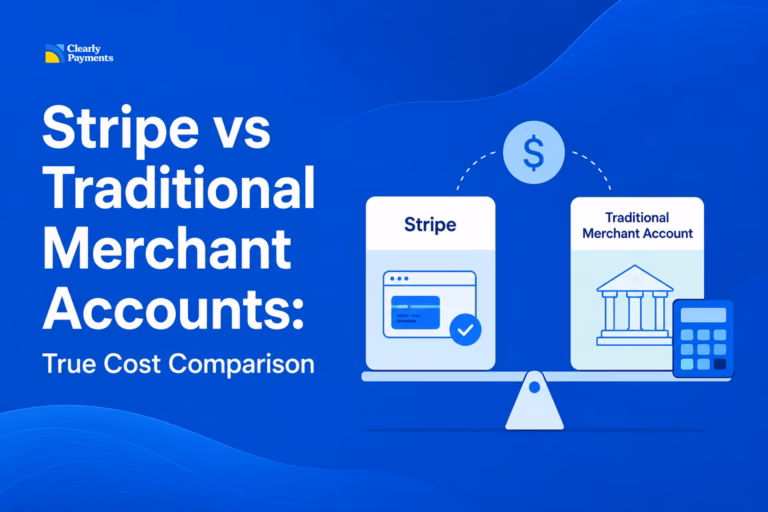
Spoiler: Processing rates are only one piece of the puzzle. Many businesses choose a payment processor based on a simple comparison: 2.9% + 30¢ sounds easy, so it must be the best option. In reality, the true cost of accepting payments depends on much more than the advertised rate. A processor
Accepting credit cards, debit cards, and digital wallets is table stakes now. In the United States, more than 80 percent of in-store transactions and essentially
Running a business today means dealing with payments. If you accept credit or debit cards, you’re part of a global system that depends on trust
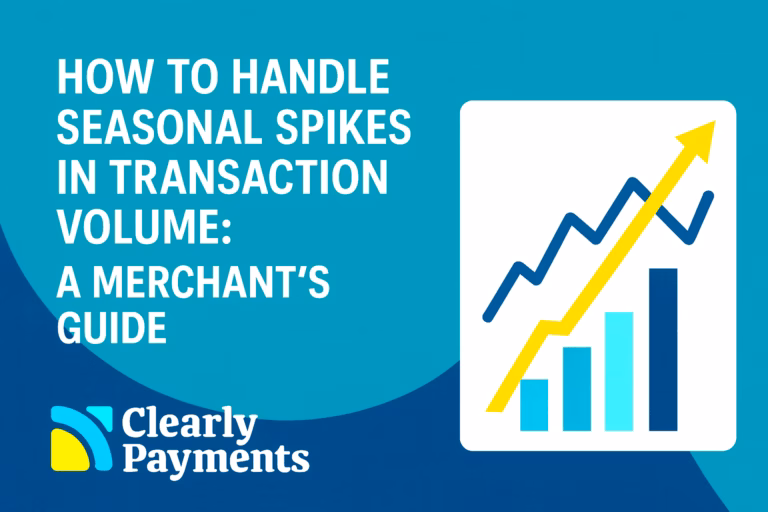
For many merchants, sales don’t flow at a steady pace year-round. Instead, they surge during certain months, holidays, or promotional periods, whether it’s Black Friday,
Interchange fees make up a large share of the cost merchants pay to accept credit and debit cards. These fees are set by card networks
Every credit card transaction tells a story. A customer decides to buy, they tap or type in their card details, and the merchant waits for

If your business accepts Visa credit or debit cards, you’re part of a global payments ecosystem that depends on trust, security, and compliance. Visa’s Acquirer

Consumers expect to pay instantly, securely, and however they prefer, whether it’s a tap, a phone, or even a crypto wallet. Across North America, physical

In 2025, the average transaction size, sometimes called average order value (AOV) or average ticket, or average transaction size (ATS), varies a lot by sector.
Every time a consumer taps their phone, swipes a card, or clicks “buy now,” they trigger one of the world’s most complex financial systems. Payments

The payment processing industry is the engine of global commerce. In 2025, the sector is projected to generate between $60 billion and $140 billion in

When a customer pays by credit card, the money does not instantly appear in the merchant’s bank account. Instead, transactions must go through several steps

Credit cards are one of the most widely used payment methods in North America. For consumers, they provide convenience, security, and rewards. For merchants, they

In 2025, merchants are projected to lose over $120 billion globally to credit card processing fees and chargebacks, yet 70% of businesses overpay due to
Credit card fraud is not just the work of isolated criminals. Today, much of it is driven by organized fraud rings, sophisticated groups that treat
Chargebacks are one of the most expensive challenges in payments. They don’t just mean lost revenue; they also come with fees, operational costs, and potential
If you run a business that accepts payments online, the way your checkout works can determine whether a sale is completed or lost. Customers expect
For Canadian merchants, payment compliance has become a cornerstone of doing business in 2025. As digital payments grow and fraud attempts increase, regulators are tightening
The Payment Card Industry Data Security Standard (PCI DSS) has always been the backbone of protecting cardholder data. With the release of PCI DSS v4.0
In payments, staying compliant isn’t optional; it’s a core part of running a sustainable business. For U.S. merchants, the rules around payment security, fraud prevention,
In 2024, Canadians reported over CAD $638 million in fraud losses, according to the Canadian Anti-Fraud Centre (CAFC). Credit card and payment fraud remain major
In 2024, U.S. consumers suffered over $12.5 billion in fraud losses, a 25% increase from 2023. Credit‑card fraud remained the most prevalent form of identity theft,