Key Takeaways
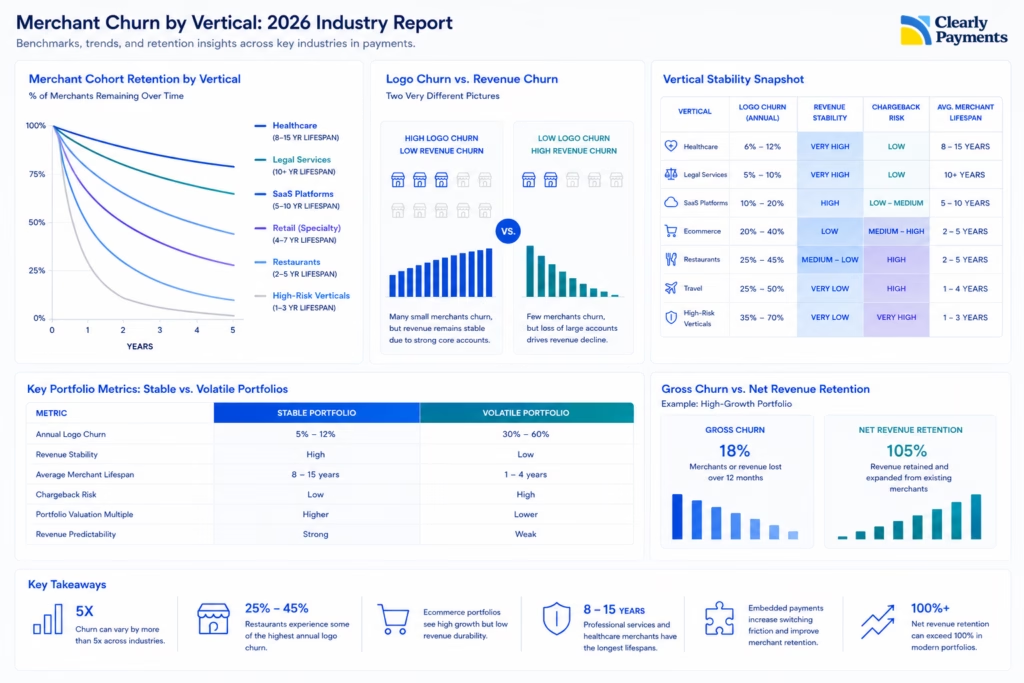
- Merchant churn can vary by more than 5x depending on vertical, with professional services below 10% annual logo churn while high-risk ecommerce categories are 50%
- Restaurants frequently experience 25% to 45% annual logo churn, driven by business failures, POS migrations, ownership turnover, and embedded payment switching
- Ecommerce portfolios often show stronger onboarding growth but weaker revenue durability due to advertising dependency, platform risk, and merchant concentration
- Many of the most valuable acquiring portfolios are concentrated in “boring” verticals such as healthcare, legal, accounting, and property management, where merchant lifespans commonly exceed 8 to 10 years
- Embedded payment platforms are materially reducing churn, with merchants using embedded payments often showing 2x to 4x higher retention rates due to increased switching friction and deeper integration into daily workflows.
- High-growth portfolios can still destroy value when CAC exceeds 12 to 24 months payback, fraud losses rise above 1%, or merchant churn materially erodes lifetime value.
- In some modern software-driven payment portfolios, net revenue retention can exceed 100% even while logo churn remains elevated
Portfolio valuation multiples increasingly depend on retention and integration depth, with embedded platforms often achieving 90%+ retention and higher multiples than traditional ISOs.
Merchant churn is one of the most important drivers of long-term portfolio value in payments, yet it is often misunderstood outside the acquiring industry.
At a surface level, churn appears simple: merchants either stay or leave. In reality, payment portfolios behave very differently depending on vertical, merchant size, software dependency, underwriting quality, seasonality, and business model durability.
A restaurant portfolio with 25% annual logo churn may still produce acceptable economics if surviving merchants grow volume over time. Meanwhile, a seemingly stable SaaS portfolio can experience significant revenue churn if a handful of large accounts migrate to embedded payment providers.
In 2026, sophisticated acquirers increasingly evaluate portfolios using:
- Logo churn
- Revenue churn
- Gross profit retention
- Same-store sales growth
- Merchant cohort aging
- Risk-adjusted retention
- Revenue concentration
- Net revenue retention (NRR)
This report examines how churn behaves across major merchant verticals and why retention quality has become one of the defining metrics in modern payments.
Merchant Churn by Vertical: 2026 Industry Report
What Is Merchant Churn?
Merchant churn refers to merchants that stop processing with a provider over a given period of time. However, not all churn has the same economic impact.
Processors typically evaluate two separate metrics:
| Metric | Definition | Why It Matters |
|---|---|---|
| Logo Churn | Number of merchants lost | Measures merchant retention and portfolio stability |
| Revenue Churn | Processing volume or revenue lost | Measures economic impact |
| Gross Profit Churn | Net revenue or margin lost | Reflects actual portfolio profitability |
These metrics often diverge significantly.
For example:
- Losing 50 very small merchants may barely impact revenue
- Losing 3 large ecommerce accounts may materially reduce portfolio profitability
- A portfolio can show declining merchant count while revenue still grows
- Same-store volume growth can offset merchant attrition
This distinction becomes especially important in portfolios with:
- Enterprise concentration
- Software integrations
- Seasonal merchants
- High-growth ecommerce brands
- Vertically integrated SaaS providers
Many sophisticated acquirers now care more about revenue durability than merchant count alone.
Why Merchant Retention Drives Portfolio Value
Payments is fundamentally a lifetime value business. Most processors incur significant upfront acquisition costs, including:
- Sales commissions
- Residual buyouts
- Underwriting
- Risk review
- Onboarding
- Hardware deployment
- Integration support
- Customer success costs
A merchant that churns after 8 months may never recover acquisition costs. By contrast, a low-maintenance professional services merchant processing consistently for 8 to 12 years can generate exceptional lifetime economics.
This is one reason why institutional buyers increasingly prioritize:
- Cohort retention
- Merchant lifespan
- Portfolio durability
- Revenue predictability
- Embedded retention characteristics
over raw onboarding growth.
Estimated Merchant Churn by Vertical (2026)
Merchant churn varies dramatically by industry. The ranges below reflect estimated North American acquiring behavior based on operator experience, portfolio economics, industry disclosures, risk profiles, and embedded payment adoption trends.
| Vertical | Estimated Annual Logo Churn | Revenue Stability | Typical Merchant Lifespan |
|---|---|---|---|
| Legal Services | 5% to 10% | Very High | 10+ years |
| Healthcare & Dental | 6% to 12% | Very High | 8 to 15 years |
| Accounting Firms | 5% to 10% | High | 10+ years |
| Property Management | 8% to 12% | High | 7 to 12 years |
| B2B Services | 8% to 15% | High | 6 to 10 years |
| Auto Repair | 10% to 18% | Medium-High | 5 to 8 years |
| SaaS Platforms | 10% to 20% | High | 5 to 10 years |
| Specialty Retail | 12% to 20% | Medium | 4 to 7 years |
| Contractors/Home Services | 15% to 30% | Medium | 3 to 6 years |
| Ecommerce Brands | 20% to 40% | Low | 2 to 5 years |
| Restaurants | 25% to 45% | Medium-Low | 2 to 5 years |
| Hospitality | 20% to 40% | Low | 2 to 5 years |
| Travel Businesses | 25% to 50% | Very Low | 1 to 4 years |
| Supplements/Nutra | 30% to 60% | Very Low | 1 to 3 years |
| CBD/High-Risk | 35% to 70% | Extremely Volatile | 1 to 3 years |
Importantly, high logo churn does not always imply weak economics. Some fast-growing portfolios generate:
- Strong same-store growth
- Rising GPV per merchant
- Expanding software monetization
- Increasing ARPU
“Boring” Verticals Produce the Best Economics
Many of the highest-quality portfolios in payments are made up of businesses that attract very little industry attention. Examples include:
- Dentists
- Veterinarians
- Legal firms
- HVAC companies
- Accountants
- Medical clinics
- Property managers
These businesses typically exhibit:
- Lower failure rates
- Predictable recurring demand
- Lower fraud exposure
- Stable ownership
- Lower support costs
- Reduced chargeback risk
- Lower processor shopping behavior
Importantly, these merchants also tend to produce stronger revenue retention alongside lower logo churn. For many acquirers, this creates superior long-term portfolio durability even if growth rates appear slower initially.
Restaurants Have Some of the Highest Logo Churn in Payments
Restaurant portfolios have historically experienced elevated churn due to structural industry characteristics. Contributing factors include:
- Thin margins
- High business failure rates
- Rising labor costs
- Seasonal traffic fluctuations
- Ownership turnover
- POS migrations
- Software bundling
However, restaurant churn analysis has become more nuanced in recent years. A restaurant may technically churn from a processor while remaining active as a merchant through:
- POS replacement
- Embedded payment migration
- Franchise ownership changes
- Acquisitions
- Multi-location consolidation
As a result, logo churn in restaurants is often much higher than actual industry business closures alone.
Ecommerce Portfolios Mask Revenue Instability
Ecommerce portfolios frequently appear attractive because of:
- Rapid boarding growth
- Large GPV spikes
- International scaling
- High transaction counts
However, ecommerce revenue durability can be highly volatile. Many ecommerce businesses depend heavily on:
- Paid advertising
- Platform algorithms
- Influencer traffic
- Consumer demand cycles
- Inventory financing
As a result:
- Same-store sales can fluctuate dramatically
- Revenue churn may exceed logo churn
- Large merchants may collapse quickly
- Portfolio concentration risk increases
Sophisticated acquirers increasingly monitor:
- Cohort decay curves
- Monthly GPV retention
- Revenue concentration
- Top merchant dependency
- Merchant aging curves
rather than simply counting boarded merchants.
Embedded Payments Are Reshaping Retention
One of the largest structural changes in payments is the rise of embedded payments. Historically, merchants selected processors directly. Today, payments increasingly flow through:
- POS systems
- Vertical SaaS platforms
- Booking software
- Ecommerce platforms
- Practice management systems
- Industry operating systems
This changes churn behavior significantly. Embedded payments often produce:
- Lower logo churn
- Higher retention
- Reduced merchant portability
- Greater pricing power
- Stronger revenue durability
Once payments become deeply integrated into workflows, switching costs rise materially. This is one reason why software-driven payment companies frequently command premium valuations.
Gross Churn vs Net Churn
Sophisticated processors increasingly separate:
- Gross churn
- Net churn
Gross churn measures merchants or revenue lost. Net churn factors in:
- Same-store sales growth
- Merchant expansion
- Cross-sell revenue
- Pricing increases
- Volume growth from retained merchants
For example:
- A portfolio may lose 18% of merchants annually
- But retained merchants may grow revenue enough to offset losses
This dynamic is especially common in:
- SaaS
- Healthcare
- Multi-location retail
- Enterprise B2B
- Software-integrated portfolios
In some cases, revenue retention can exceed 100% even while logo churn remains elevated.
High-Risk Portfolios Behave Differently
High-risk portfolios operate under very different retention dynamics.
Verticals such as:
- Supplements
- CBD
- Travel
- Coaching
- Continuity billing
- Gaming
- Nutraceuticals
often experience elevated churn because of:
- Banking instability
- Reserve requirements
- Fraud exposure
- Regulatory changes
- Card network monitoring
- Chargeback pressure
- Aggressive customer acquisition models
In high-risk acquiring, rapid merchant growth can sometimes conceal weak underlying portfolio quality.
Poorly underwritten portfolios may experience:
- Sudden volume collapses
- MID cycling
- Reserve disputes
- Sponsor bank exits
- Elevated fraud losses
As a result, risk-adjusted retention matters significantly more than raw growth.
Merchant Cohorts Matter More Than Top-Line Growth
Sophisticated acquirers increasingly analyze merchant cohorts over time.
Questions include:
- How long do merchants survive?
- Does GPV expand or contract over time?
- Which acquisition channels produce the best retention?
- Which industries generate the lowest support burden?
- How quickly do cohorts decay?
A portfolio boarding 1,000 merchants annually can still destroy value if:
- Cohorts deteriorate rapidly
- Revenue concentration increases
- Acquisition costs exceed lifetime value
- Same-store sales decline
This is why experienced operators increasingly focus on:
- Merchant quality
- Revenue durability
- Underwriting discipline
- Vertical specialization
rather than simply maximizing approvals.
Portfolio Quality Is Becoming More Important
Payment margins continue to compress across much of the industry. As a result, long-term value creation increasingly depends on:
- Retention
- Software integration
- Vertical specialization
- Operational efficiency
- Embedded distribution
- Revenue durability
The industry is shifting away from pure transactional processing toward infrastructure and workflow ownership.
In that environment, the highest-value portfolios will likely be those that combine:
- Strong merchant retention
- Stable recurring revenue
- Deep workflow integration
- Low support burden
- Predictable risk profiles
Growth still matters.
But in modern payments, durable retention increasingly determines enterprise value.