Cash usage in the United States is shrinking, but the story is more nuanced than “cash is dead.” While digital payments dominate everyday spending, cash continues to play a measurable role in specific transaction sizes, demographics, and environments across the U.S. economy.
In 2025, cash accounts for roughly 16%–18% of in-person consumer transactions and less than 10% of total transaction value. Its use is heavily concentrated in small-dollar purchases, tipping, and among older, lower-income, and unbanked consumers.
The sections below break down where cash is still used, how quickly cash is declining, and what the data means for merchants making payment acceptance decisions.
Overall Cash Usage in the United States (2025)
Cash no longer dominates consumer payments, but it remains a meaningful minority option. Understanding its true share requires looking at both transaction count and transaction value.
Key data points
- Cash accounts for ~16%–18% of in-person consumer transactions
- Down from ~26% in 2019
- Down from ~31% in 2012
- Cash represents only ~7%–9% of total transaction value
What this tells us
Cash is now concentrated in low-dollar purchases. Its decline in transaction share has been faster than its decline in consumer cash ownership.
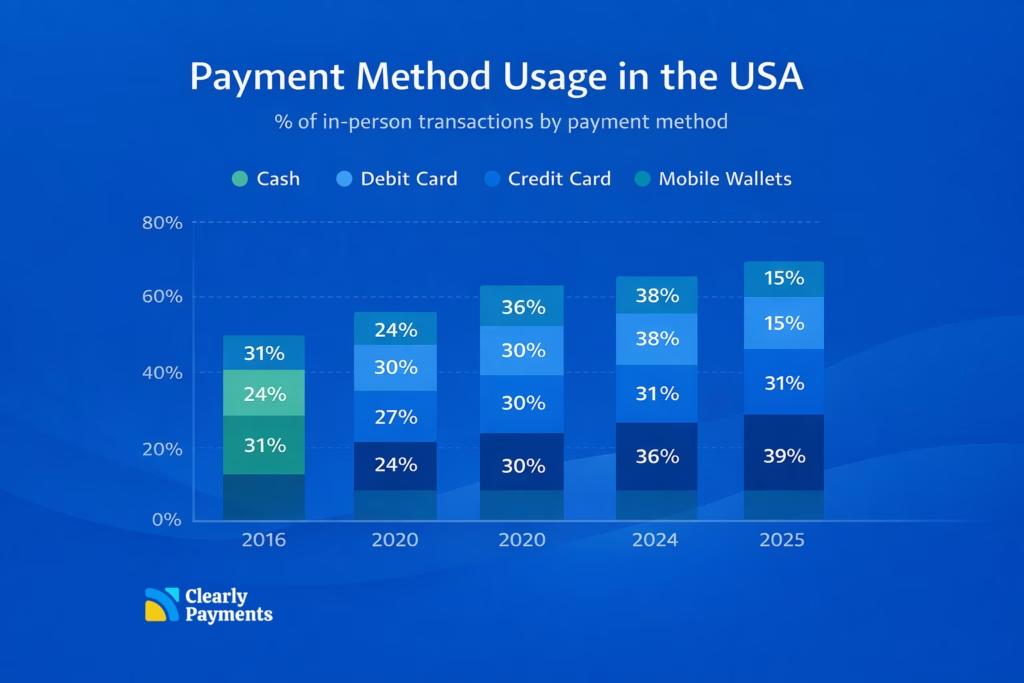
Payment Methods Replacing Cash
Cash did not disappear in isolation. Its decline closely tracks the rise of cards and mobile wallets, which absorbed nearly all lost share.
Transaction share by method
- Credit cards, ~33%–35%
- Debit cards, ~28%–30%
- Mobile wallets, ~12%–15%
- Cash, ~16%–18%
- Other methods (ACH, checks, BNPL, etc.), <5%
Share of total transaction value
- Credit cards, ~55%–60%
- Debit cards, ~20%–25%
- Cash, <10%
What this tells us
Debit replaced cash for everyday spending, while credit dominates higher-value purchases and ecommerce.
How Much Cash Americans Still Carry
Even as usage falls, most Americans still keep cash on hand. Carrying cash and spending cash are now very different behaviors.
Key data points
- ~82%–85% of U.S. adults carry cash
- Median amount carried, $40–$60
- ~20% carry $100+
- ~10%–12% report never carrying cash
What this tells us
Cash is viewed as a backup or emergency option, not a preferred way to pay.
Where Cash Is Still Commonly Used
Cash usage is highly concentrated rather than evenly distributed across the economy. A small number of use cases account for most remaining cash transactions.
High cash usage categories
- Transactions under $10, ~35%–40% paid in cash
- Food trucks and pop-up vendors
- Convenience stores
- Farmers markets
- Tips and gratuities
Low cash usage categories
- Ecommerce, <2%
- Travel and lodging, <5%
- Subscription services, <1%
What this tells us
Cash survives where speed, anonymity, or informality matters most.
Demographic Differences in Cash Usage
Cash usage is not uniform across the population. Age, income, and location strongly influence how often consumers use cash.
By age
- Age 65+, ~25%–30% of transactions
- Age 45–64, ~18%–20%
- Age 18–29, ~10%–12%
By income
- Households under $30k, ~23%–26%
- Households over $100k, ~10%–12%
By geography
- Rural areas use cash ~5–7 percentage points more than urban cores
- Dense metro areas show the fastest decline
What this tells us
Cash is increasingly concentrated among older, lower-income, and rural consumers.
Unbanked and Underbanked Consumers
For some consumers, cash is not a preference, it is a necessity. This group is small but economically significant.
Key data points
- ~5% of U.S. households are unbanked
- ~13%–15% are underbanked
- Cash accounts for 50%+ of transactions among unbanked households
According to the Federal Reserve, these consumers rely on cash to avoid overdraft fees, account minimums, and payment declines.
What this tells us
Removing cash can exclude a real portion of potential customers.
Cashless Stores and Legal Requirements
Cashless retail gets headlines, but regulation limits how far it can go. Many jurisdictions still require merchants to accept cash.
Key data points
- Several U.S. states and cities mandate cash acceptance
- Cashless models are most common in:
- Stadiums
- Airports
- Event venues
- University campuses
- Neighborhood retail remains largely cash-accepting
What this tells us
Cashless works in controlled environments, but is harder to scale universally.
What Cash Really Costs Merchants
Cash often appears cheaper than card payments, but when labor, reconciliation, theft, and deposit handling are included, studies show cash can cost merchants 1%–4% of revenue to manage.
Estimated cash handling costs ~1%–4% of revenue, including:
- Staff counting time
- Reconciliation errors
- Theft and shrink
- Bank deposits
- Armored transport
Comparison
- Cards have visible processing fees
- Cash has hidden operational costs that scale poorly
What this tells us
Cash is not free, it is just less transparent.