Every time a consumer taps their phone, swipes a card, or clicks “buy now,” they trigger one of the world’s most complex financial systems. Payments aren’t just a back-office function; they’re the invisible infrastructure of global commerce, quietly moving over $2 trillion per day across networks. The payments industry generates more revenue than the airline industry, and it touches every business, from local coffee shops to trillion-dollar e-commerce platforms.
Behind transactions are multiple players, such as processors, acquirers, gateways, fraud specialists, terminal providers, and more, each taking a small cut, and each critical to making payments fast, secure, and seamless.
This article breaks down the key categories of players, the size of each market, and how their business models work, with a look at the trends that are reshaping payments in 2025 and beyond.
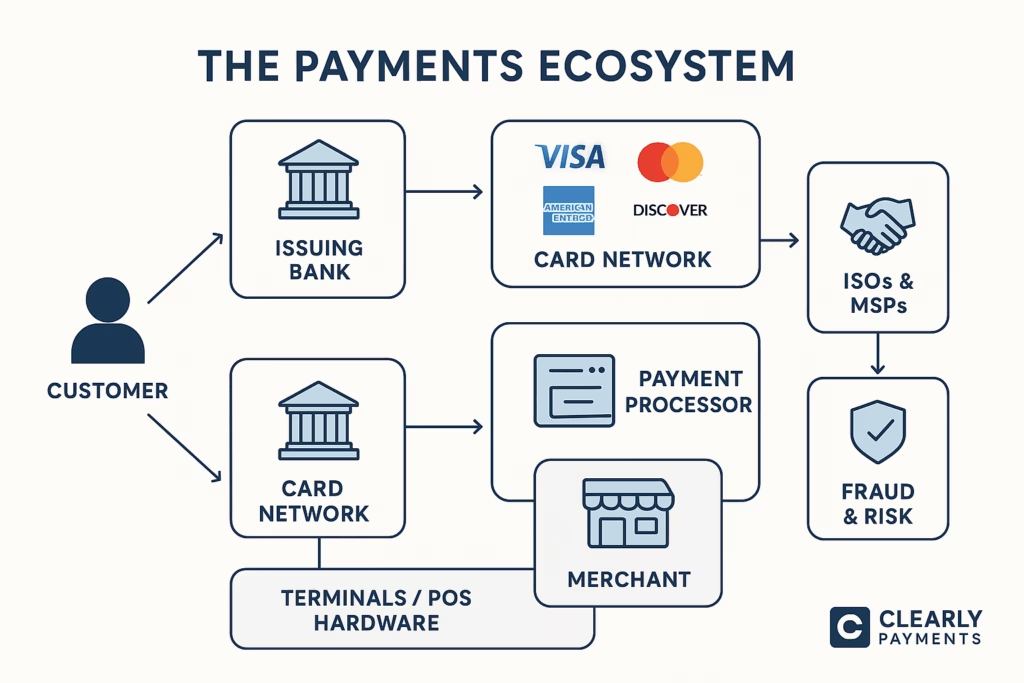
Card Networks
Every second, Visa and Mastercard together process over 15,000 transactions across the globe. Card networks set the rules of payment acceptance and ensure interoperability between billions of cards and millions of merchants.
- Market size: $70+ billion annually
- Revenue model: Transaction and assessment fees, licensing
- Key players: Visa, Mastercard, Amex, Discover, UnionPay
| Year | Visa Volume (USD T) | Mastercard Volume (USD T) | Combined Total (USD T) |
|---|---|---|---|
| 2020 | 8.8 | 4.0 | 12.8 |
| 2023 | 11.6 | 4.9 | 16.5 |
| 2025e | 12.5 | 5.2 | 17.7 |
Issuing Banks
Credit and debit cards are issued by issuing banks, which collectively earn over $300 billion annually, mostly from interest on revolving balances. In the U.S. alone, cardholders carry over $1 trillion in outstanding credit card debt (2025).
- Market size: $300+ billion annual revenue
- Revenue model: Interest, interchange share, late fees, annual fees
- Key players: Chase, Citi, Capital One, BofA, Barclays
Table: U.S. Credit Card Market Snapshot (2025)
| Metric | Value |
|---|---|
| Total outstanding balances | $1.0T+ |
| Avg. annual interest rate | ~20% |
| Annual issuer revenues | $300B+ |
| Leading issuers | Chase, Citi, Capital One, BofA |
Acquirers / Merchant Banks
Acquirers are the backbone for merchants; they underwrite accounts, handle settlements, and absorb some fraud risk. In 2024, global acquiring revenues were about $48 billion, with steady growth driven by SMB digitization.
- Market size: $45–50 billion
- Revenue model: Merchant discount rates, account fees, risk reserves
- Key players: Fiserv, Global Payments, Elavon, Worldpay
Table: Market Share of Top U.S. Acquirers (2024)
| Acquirer | Market Share (%) |
|---|---|
| Fiserv (First Data) | 20% |
| Chase Paymentech | 17% |
| Worldpay (FIS) | 15% |
| Elavon | 10% |
| Others | 38% |
Payment Processors
Payment processors ensure transactions travel in milliseconds between merchants, acquirers, and networks. Companies like Stripe and Adyen have transformed this space with developer-friendly APIs and global reach.
- Market size: $60–80 billion globally
- Revenue model: Per-transaction fees, SaaS platform fees, FX margins
- Key players: Adyen, Stripe, PayPal (Braintree), Square, Worldline
| Processor | Annual Volume (USD T) | Revenue (USD B) |
|---|---|---|
| Adyen | ~1.0 | ~1.6 |
| Stripe | ~1.0 | ~4.5 |
| PayPal/Braintree | ~1.5 | ~29 |
| Square | ~0.2 | ~5.8 |
| Worldline | ~0.4 | ~5.0 |
Independent Sales Organizations (ISOs)
ISOs and agents remain vital, especially for small merchants. Roughly 25% of all U.S. merchants still sign up for accounts through ISOs, which create billions in residual revenues. ISOs play a vital role in the payments ecosystem, often acting as the most innovative link between merchants and processors, and are known for delivering some of the best customer service and tailored solutions in the industry.
- Market size: Billions in annual commissions
- Revenue model: Residual splits with acquirers, leasing, setup fees
- Key players: NAB, Priority, Paysafe ISOs, thousands of regional ISOs
Table: ISO Contribution in U.S. Merchant Accounts
| Category | Share (%) |
|---|---|
| Signed via ISOs | 25–30% |
| Signed via acquirers directly | 40–45% |
| Signed via MSPs (like Clearly Payments, Helcim) | 25–30% |
Fraud & Risk Solutions
Fraud is exploding: projected to reach $40 billion in annual losses in 2025. Fraud prevention providers now use AI, biometrics, and global data-sharing to cut losses for merchants.
- Market size: $30B+ today, growing to $85B by 2028
- Revenue model: SaaS subscriptions, per-transaction fees, chargeback guarantees
- Key players: Riskified, Forter, Sift, Kount, Signifyd
Table: Global Online Payment Fraud Losses
| Year | Estimated Losses (USD B) |
|---|---|
| 2020 | 20 |
| 2022 | 28 |
| 2025e | 40 |
Terminals & Payment Hardware
Every tap or dip in-store requires hardware. The POS market is projected to reach $90 billion by 2025, boosted by mobile-first readers and cloud-based POS systems.
- Market size: $90 billion (2025)
- Revenue model: Hardware sales, leasing, SaaS add-ons
- Key players: Verifone, Ingenico, PAX, Square, Clover
Table: POS Terminal Market Trends (2025)
| Category | Share (%) |
|---|---|
| Traditional countertop POS | 40 |
| Mobile POS / readers | 35 |
| Android-based smart POS | 25 |
Merchant Service Providers (MSPs)
MSPs like Clearly Payments bundle together acquiring, processing, fraud tools, terminals, and support into one seamless service for merchants. This reduces complexity and cost while improving transparency.
- Market size: Multi-billions
- Revenue model: Interchange-plus, subscriptions, bundled services
- Key players: Clearly Payments, Helcim, Stripe, Square, Chase Paymentech
Table: MSP Pricing Models
| Pricing Model | Typical Approach |
|---|---|
| Interchange-plus | Interchange + fixed markup |
| Flat subscription | Monthly fee + interchange pass-through |
| Bundled (tiered) | Blended rates by transaction type |
| Equipment add-ons | Hardware sales, rental, SaaS POS |
How the Payments Ecosystem Is Changing
The payments industry is shifting quickly with technology, regulation, and consumer behavior. Several trends are reshaping the ecosystem and how merchants interact with it:
- Embedded Payments: More software platforms (like Shopify, Uber, and Toast) are embedding payments directly into their services, blurring the line between software and financial services.
- Digital Wallets & Alternative Payments: By 2025, wallets like Apple Pay, Google Pay, and Alipay are projected to account for over 50% of global e-commerce transactions. Buy Now, Pay Later (BNPL) is also growing, especially among younger consumers.
- Real-Time Payments: Networks like RTP in the U.S. and UPI in India are pushing instant settlement, bypassing some traditional card rails.
- AI & Fraud Prevention: Fraud is rising, but so are AI-driven tools that can detect anomalies in real time, reducing false declines and chargebacks.
- Subscription Pricing & Transparency: Merchants are increasingly rejecting hidden fees in favor of flat subscription or interchange-plus pricing models, one reason why providers like Clearly Payments are gaining traction.
- Crypto & Tokenized Payments: While still niche, stablecoins and tokenized bank deposits are being piloted by large networks as future rails for settlement.