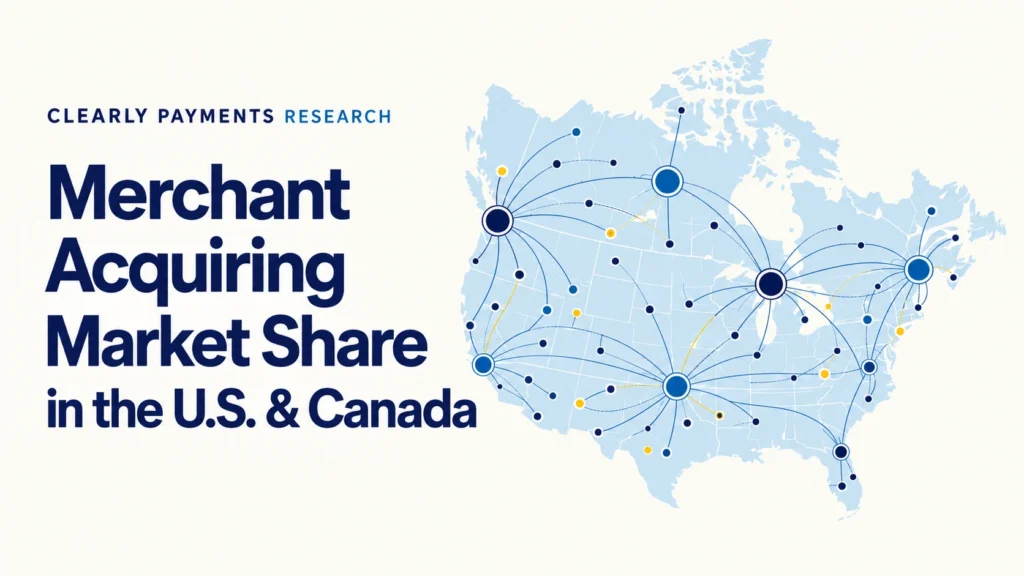
The U.S. and Canada represent two of North America’s largest merchant acquiring markets, but their competitive structures are quite different. Clearly Payments Research estimates U.S. merchants generated US$12.5 trillion in card purchase value in 2025, compared with approximately C$1.25 trillion in Canada. Canada has the more concentrated acquiring market, with the three largest portfolios accounting for an estimated 73% of purchase value, compared with 62% in the U.S.
This report examines the size and structure of both markets, the largest acquiring portfolios, the revenue behind them and how merchant distribution is changing. It also looks at the growing influence of software platforms, the continuing value of bank referrals, recent consolidation and what these shifts could mean for merchant acquiring through 2030.
In this report
Executive findings
- Canadian merchants generated approximately C$1.25 trillion in card purchases in 2025, up 4.1% from the revised 2024 total.
- U.S. merchant card purchase value is estimated at US$12.5 trillion in 2025. The combined U.S. and Canada market is approximately US$13.4 trillion.
- Moneris’s estimated share is 33% of Canadian merchant card purchase value.
- Global Payments / Worldpay holds an estimated 24% of Canadian purchase value. Chase holds approximately 16%.
- Canada has a more concentrated acquiring core than the United States. The three largest Canadian portfolios account for an estimated 73% of purchase value, compared with 62% in the U.S.
- The five largest portfolios account for an estimated 84% of Canadian purchase value and 74% in the United States.
- Canada has an estimated 14 meaningful commercial acquiring provider families with more than C$1 billion in annual domestic volume.
- Retained acquiring revenue is an estimated C$3.6 billion in Canada and US$46 billion in the United States.
- Software- and platform-led distribution controls an estimated 21% of Canadian payment value and 33% in the United States.
- By 2030, the base case reaches approximately US$16 trillion in U.S. card purchase value and C$1.5 trillion in Canada. Software- and platform-led distribution reaches approximately 42% and 28%, respectively.
How large is the merchant acquiring market?
Merchant acquiring connects businesses to card payment networks and turns approved purchases into merchant settlement. Its economic scale depends on how much merchants accept, who holds those relationships and how much revenue remains after payment-network costs.
U.S. merchant card purchase value is estimated at US$12.5 trillion in 2025. The estimate is anchored to Nilson Report’s US$12.498 trillion of purchases on U.S.-issued cards, adjusted for the difference between the cardholder’s country and the merchant’s country. Nilson Report’s 2025 card-purchase figures.
In Canada, merchant credit, debit and prepaid purchases totalled approximately C$1.25 trillion across 17.6 billion transactions. Purchases grew by 4.1% against revised 2024 figures from the same Payments Canada report. Payments Canada, Canadian Payment Methods and Trends 2026.
| Market | 2025 merchant card purchase value | Basis |
|---|---|---|
| United States | US$12.5 trillion | Clearly Payments Research estimate |
| Canada | Approximately C$1.25 trillion | Clearly Payments Research calculation from Payments Canada |
| United States and Canada combined | US$13.4 trillion | Clearly Payments Research estimate, converted to U.S. dollars |
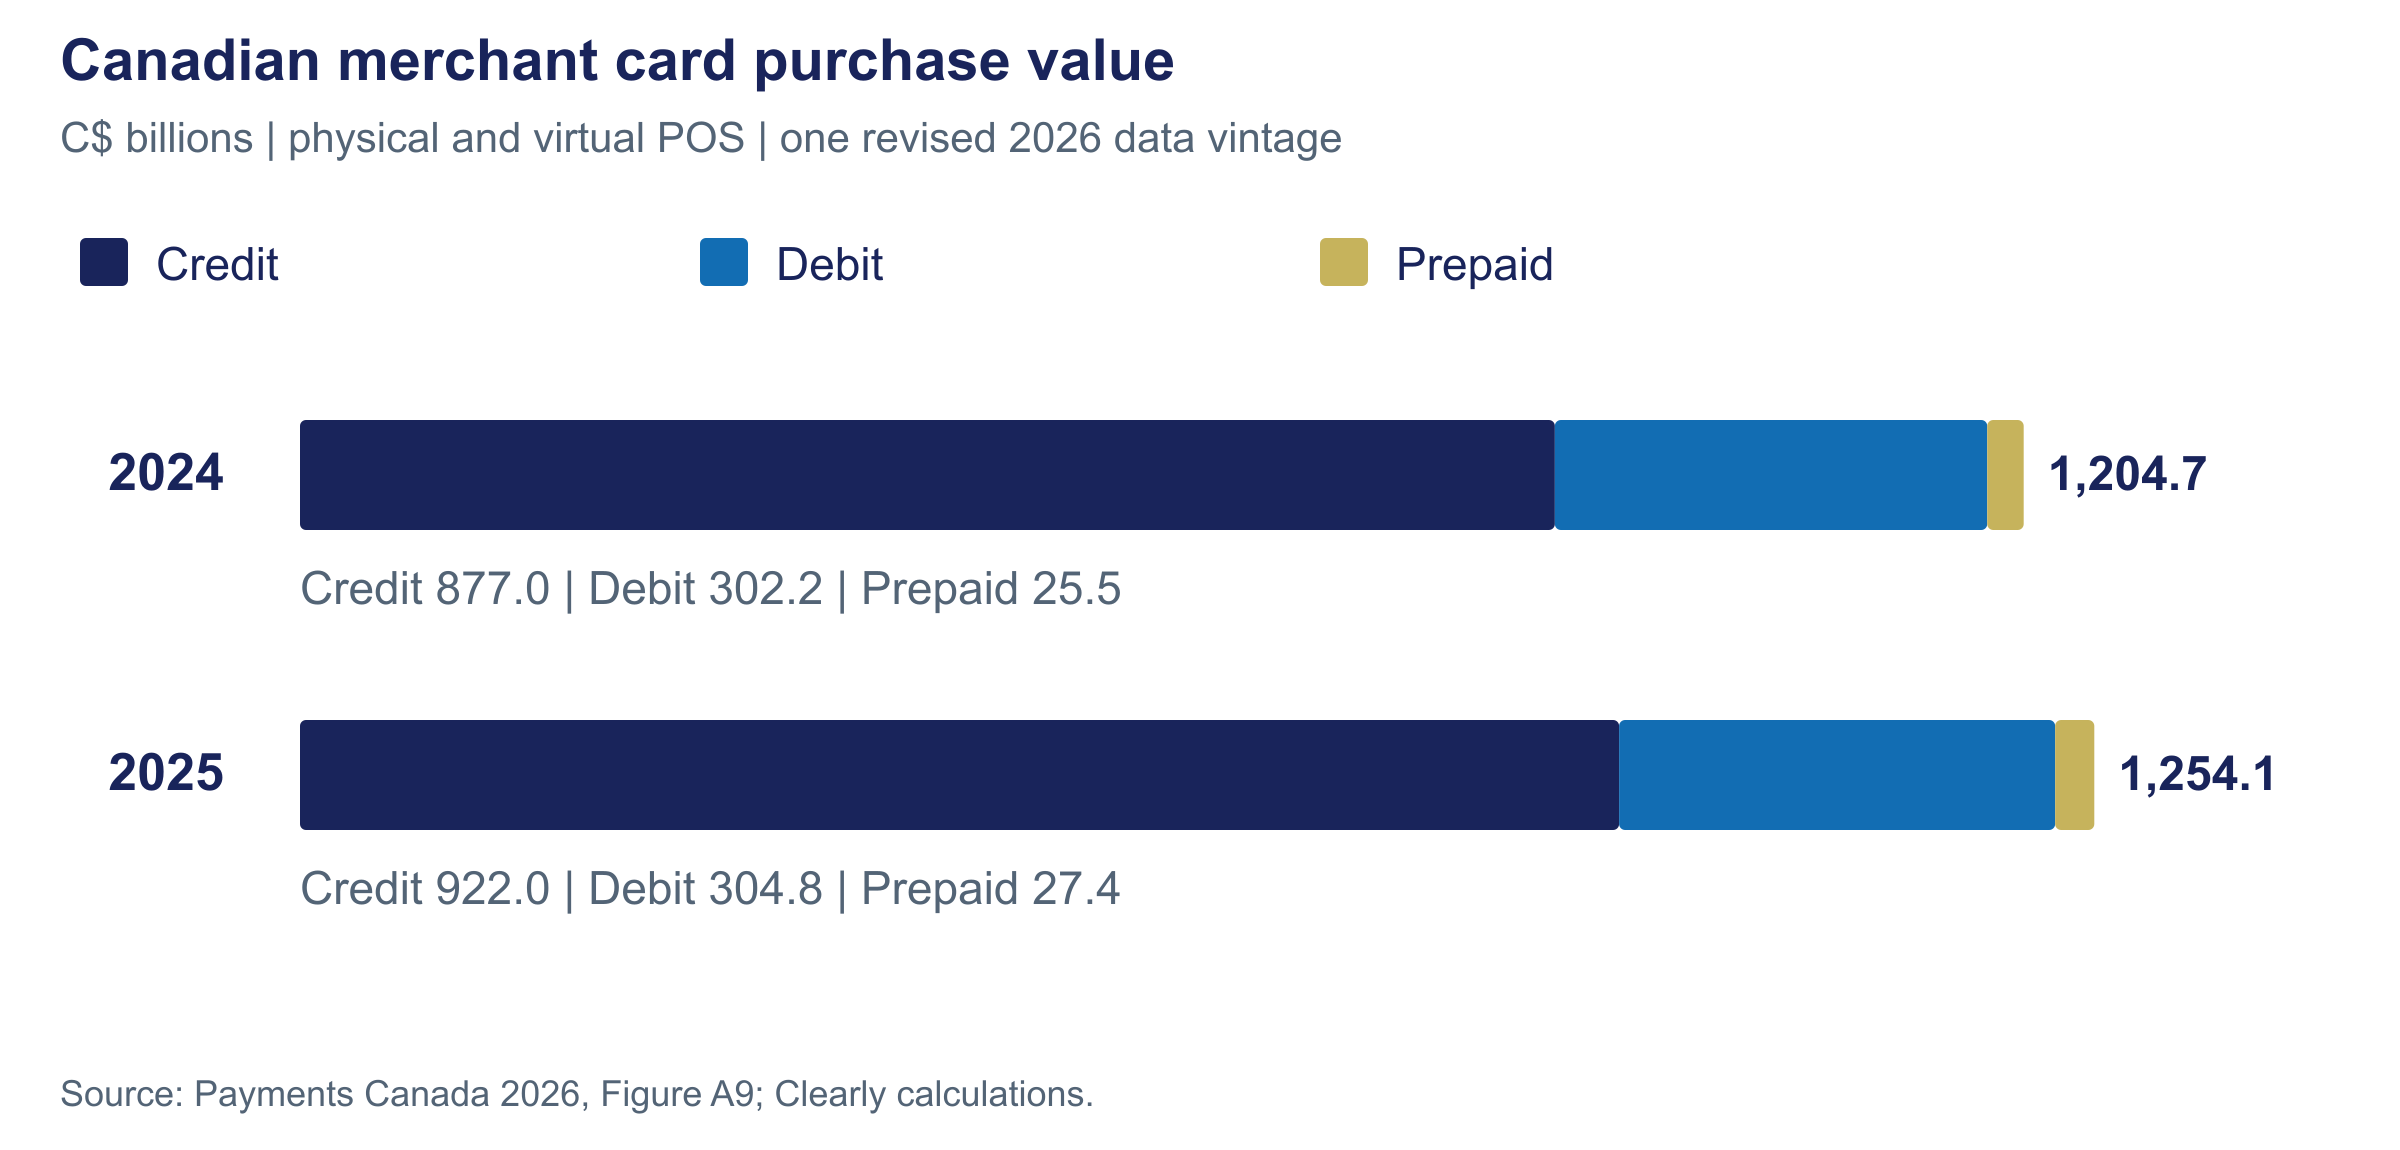
Canadian figures are in Canadian dollars. Combined value uses the 2025 average exchange rate of C$1.3978 per US$1. North America in this report means the U.S. and Canada.
At a common exchange rate, the U.S. market is approximately fourteen times Canada’s purchase value. That difference gives U.S. providers more room to build large specialist portfolios. It also helps explain why Canada can support many merchant-service brands while concentrating most purchase value in a smaller group of acquiring portfolios. Bank of Canada annual exchange rates.
Who are the largest merchant acquirers in Canada?
Moneris, Global Payments / Worldpay and Chase form the largest tier of Canadian merchant acquiring. Together, they account for an estimated 73% (65%–80%) of domestic merchant card purchase value.
Below that group, TD’s retained portfolio and Fiserv’s Canadian business remain distinct. Their technology partnership does not mean Fiserv acquired every TD merchant relationship. Elavon and international platforms add further competition, with overlapping estimated ranges below the largest portfolios.
| Commercial portfolio | Estimated share of Canadian purchase value | Estimated annual Canadian volume |
|---|---|---|
| Moneris | 33% (29%–36%) | Approximately C$410 billion (C$360–455 billion) |
| Global Payments / Worldpay | 24% (21%–27%) | Approximately C$300 billion (C$260–340 billion) |
| Chase | 16% (15%–17%) | Approximately C$200 billion (C$185–215 billion) |
| TD retained portfolio | 6% (5%–7%) | Approximately C$75 billion (C$60–90 billion) |
| Fiserv / acquired TD subset | 5% (4%–6%) | Approximately C$63 billion (C$50–80 billion) |
| Elavon | 3% (2%–4%) | Approximately C$38 billion (C$25–55 billion) |
| Stripe | 3% (1.5%–5%) | Approximately C$38 billion (C$15–65 billion) |
| PayPal / Braintree | 2% (1%–3.5%) | Approximately C$25 billion (C$10–45 billion) |
| Square | 1.2% (0.8%–1.8%) | Approximately C$15 billion (C$10–23 billion) |
| Adyen | 1% (0.5%–2%) | Approximately C$13 billion (C$6–26 billion) |
Clearly Payments Research estimates for 2025 activity under the 2026 ownership structure. Volumes are rounded. The table shows selected portfolios, ordered by central estimates. Overlapping ranges do not establish exact ranks. It excludes smaller portfolios and direct American Express acceptance, so the rows are not intended to total 100%.
Global Payments’ acquisition of the Desjardins merchant portfolio is part of its Canadian position. Counting Desjardins as another independent acquiring portfolio would overstate the number of major competitors. Global Payments’ Desjardins agreement.
An estimated 14 (12–18) meaningful commercial provider families exceed C$1 billion in annual Canadian volume. Approximately 12 (10–12) portfolio families exceed C$10 billion. That is a measure of economically significant acceptance businesses, rather than a count of every reseller, gateway or sponsor bank.
Other participants include Nuvei and direct American Express acceptance. Nuvei’s launch of direct local acquiring adds another route to Canadian acceptance. Its history in the market predates that launch. Nuvei’s Canadian direct-acquiring announcement.
Moneris and the changing Canadian market
Moneris’s estimated share is 33% (29%–36%) of Canadian merchant card purchase value, representing approximately C$410 billion (C$360–455 billion) annually. Its installed base and bank distribution make it the reference point for competition in Canada.
Moneris reports more than 325,000 points of commerce and describes its transaction footprint as roughly one third of the country’s transactions. Those are company scale disclosures. The value-share estimate measures a different quantity: the dollars spent at Canadian merchants. Moneris’ August 2026 announcement.
As of 27 October 2026, the proposed acquisition by Francisco Partners remains pending. The announced consideration is approximately C$2 billion. Moneris is being sold by BMO and RBC, with closing expected by the end of the banks’ first fiscal quarter of 2027, subject to approvals and other closing conditions. Transaction terms and expected timing.
The agreement also provides for long-term exclusive customer referrals from BMO and RBC. A change in Moneris’s ownership does not remove its bank-linked distribution. That distinction matters more to its competitive position than the ownership label alone.
The transaction changes who owns a major existing portfolio. It does not, by itself, merge Moneris with another large Canadian acquiring book. The competitive questions concern what the new owner does with that position: investment in software integrations, the strength of referral conversion and the ability to serve merchants across online and physical commerce.
Those are questions for operating performance after closing. The announced sale does not establish future pricing, service changes or market-share gains.
Who are the largest U.S. merchant acquirers?
Global Payments / Worldpay, Fiserv and JPMorgan Chase form the leading U.S. tier. Their scale comes from different combinations of direct merchant relationships, bank distribution and acquired portfolios.
Published rankings answer different questions. TSG places Global Payments / Worldpay first after combining the businesses under their current parent. Nilson’s ranking of 2025 merchant acquirers names Fiserv first. Group ownership and merchant-contract ownership can produce different leaders. TSG’s public 2026 directory summary, Fiserv’s Nilson ranking announcement.
The following comparison uses publicly disclosed scale for selected leaders. The estimated shares compare those portfolios with national merchant card purchase value.
| Provider | Publicly reported U.S. scale | Clearly Payments Research estimated share |
|---|---|---|
| Global Payments / Worldpay | Nearly US$2.8 trillion in 2025 activity, combined under the current parent | 22% (19%–24%) |
| Fiserv | US$2.6 trillion in 2025 merchant transactions | 20% (15%–22%) |
| Stripe | More than US$900 billion in 2025 processing volume | 7% (6%–8%) |
Selected providers, not a complete ranking. Global Payments / Worldpay and Stripe scale figures are TSG estimates from its public summary. Fiserv’s figure is a company disclosure. Share ranges are Clearly Payments Research estimates of national merchant card purchase value.
TSG’s public ranking places Fiserv at approximately US$2.2 trillion, while Fiserv discloses US$2.6 trillion of U.S. merchant transactions. These definitions differ; the concentration estimates allow for that scope difference and possible overlap between platform and upstream processing books. Public TSG provider figures.
Fiserv’s US$2.6 trillion disclosure illustrates the scale of a large incumbent. Stripe’s U.S. processing volume shows that platform distribution has also become large enough to matter nationally. These business models can compete for merchant control while sharing parts of the payment infrastructure. Fiserv’s U.S. transaction-volume disclosure.
A global payment-volume headline is not a U.S. market share. Country coverage and the inclusion of non-card payments must be reconciled before a provider can be compared with domestic merchant purchasing.
Canada vs U.S. merchant acquiring concentration
Canada has a more concentrated acquiring core than the United States. The three largest Canadian portfolios account for an estimated 73% (65%–80%) of merchant card purchase value, compared with 62% (53%–65%) in the U.S.
The difference remains visible across the leading five and ten portfolios. In the central case, the five largest portfolios account for approximately 84% of purchase value in Canada and 74% in the U.S. The ranges overlap, but this comparison points to a larger share of Canadian purchasing going through the biggest portfolios.
| Share held by largest portfolios | Canada | United States |
|---|---|---|
| Top three, or CR3 | Approximately 73% (65%–80%) | Approximately 62% (53%–65%) |
| Top five, or CR5 | Approximately 84% (75%–92%) | Approximately 74% (64%–78%) |
| Top ten, or CR10 | Approximately 96% (93%–98%) | Approximately 90% (78%–94%) |
Clearly Payments Research estimates of merchant card purchase value, using 2025 activity and the 2026 ownership structure. Each concentration measure adds the largest portfolios within each country.
Concentration affects how a challenger grows. In Canada, winning substantial purchase volume usually means taking business from a small group of established portfolios. In the U.S., a larger market supports more providers at meaningful scale, even though its leaders remain very large.
More software competition does not automatically mean less acquiring concentration. A platform can take control of onboarding and pricing while continuing to route payments through a large incumbent. Acquiring share falls only when the commercial portfolio moves to another provider.
Why the two markets differ
Bank relationships help explain Canada’s concentrated core. Bank of Canada research documents the historical importance of Moneris and other bank-linked franchises. More recent referral agreements show how those relationships can survive changes in ownership. Bank of Canada research on merchant acquiring.
Clearly Payments Research estimates bank-linked acceptance franchises represent approximately 84% (75%–92%) of Canadian purchase value. This includes merchants acquired through software and direct sales inside those franchises. It is broader than the share of merchants choosing a provider through a bank referral.
Market size also matters. The larger U.S. payment base gives a specialist provider more room to reach scale in a single industry or distribution channel. Canada’s smaller base increases the value of established referral networks and a broad merchant installed base.
Domestic debit creates another distinction. Debit contributes about one quarter of Canadian merchant card purchase value and a larger share of card transactions. A credit-only comparison misses a material part of the Canadian acceptance business. Payments Canada’s card purchase data.
Software competition cuts across these structures. A provider entering through a merchant’s accounting, restaurant or commerce platform can influence payment selection without first matching an incumbent’s bank branch network.
Who controls the merchant relationship?
The company settling a payment is not always the company that wins or renews the merchant. The relationship may sit with a bank, an ISO or the software platform that runs the merchant’s business.
Clearly Payments Research estimates banks are the primary selection or renewal channel for approximately 37% (30%–45%) of Canadian purchase value, compared with approximately 15% (10%–20%) in the United States. Those figures measure distribution influence. They do not measure bank ownership of processors.
The Moneris transaction makes the distinction concrete. BMO and RBC are selling their ownership stakes while preserving exclusive referral arrangements. National Bank also refers merchants to Clover/Fiserv, showing another way a bank can distribute acceptance without owning the provider. National Bank’s merchant payment offering.
For operators, the practical question is who can renew the agreement, change pricing or move the payment relationship. A processor can retain transaction volume while a platform captures more of those decisions. That changes the economics of the relationship before it changes the national volume ranking.
Software-led acquiring and embedded payments
Software-led acquiring puts payment selection inside a business workflow. A restaurant may choose acceptance through its operating system. An online retailer may activate it through its commerce platform. The payment provider is selected as part of running the business.
Software- and platform-led distribution controls an estimated 21% (15%–25%) of Canadian payment value and 33% (25%–41%) in the United States. Across the two markets, the estimate is approximately 32% (24%–40%).
| Market | Estimated share today | 2030 Clearly Payments Research base case |
|---|---|---|
| Canada | 21% (15%–25%) | Approximately 28% |
| United States | 33% (25%–41%) | Approximately 42% |
| United States and Canada combined | 32% (24%–40%) | Approximately 41% |
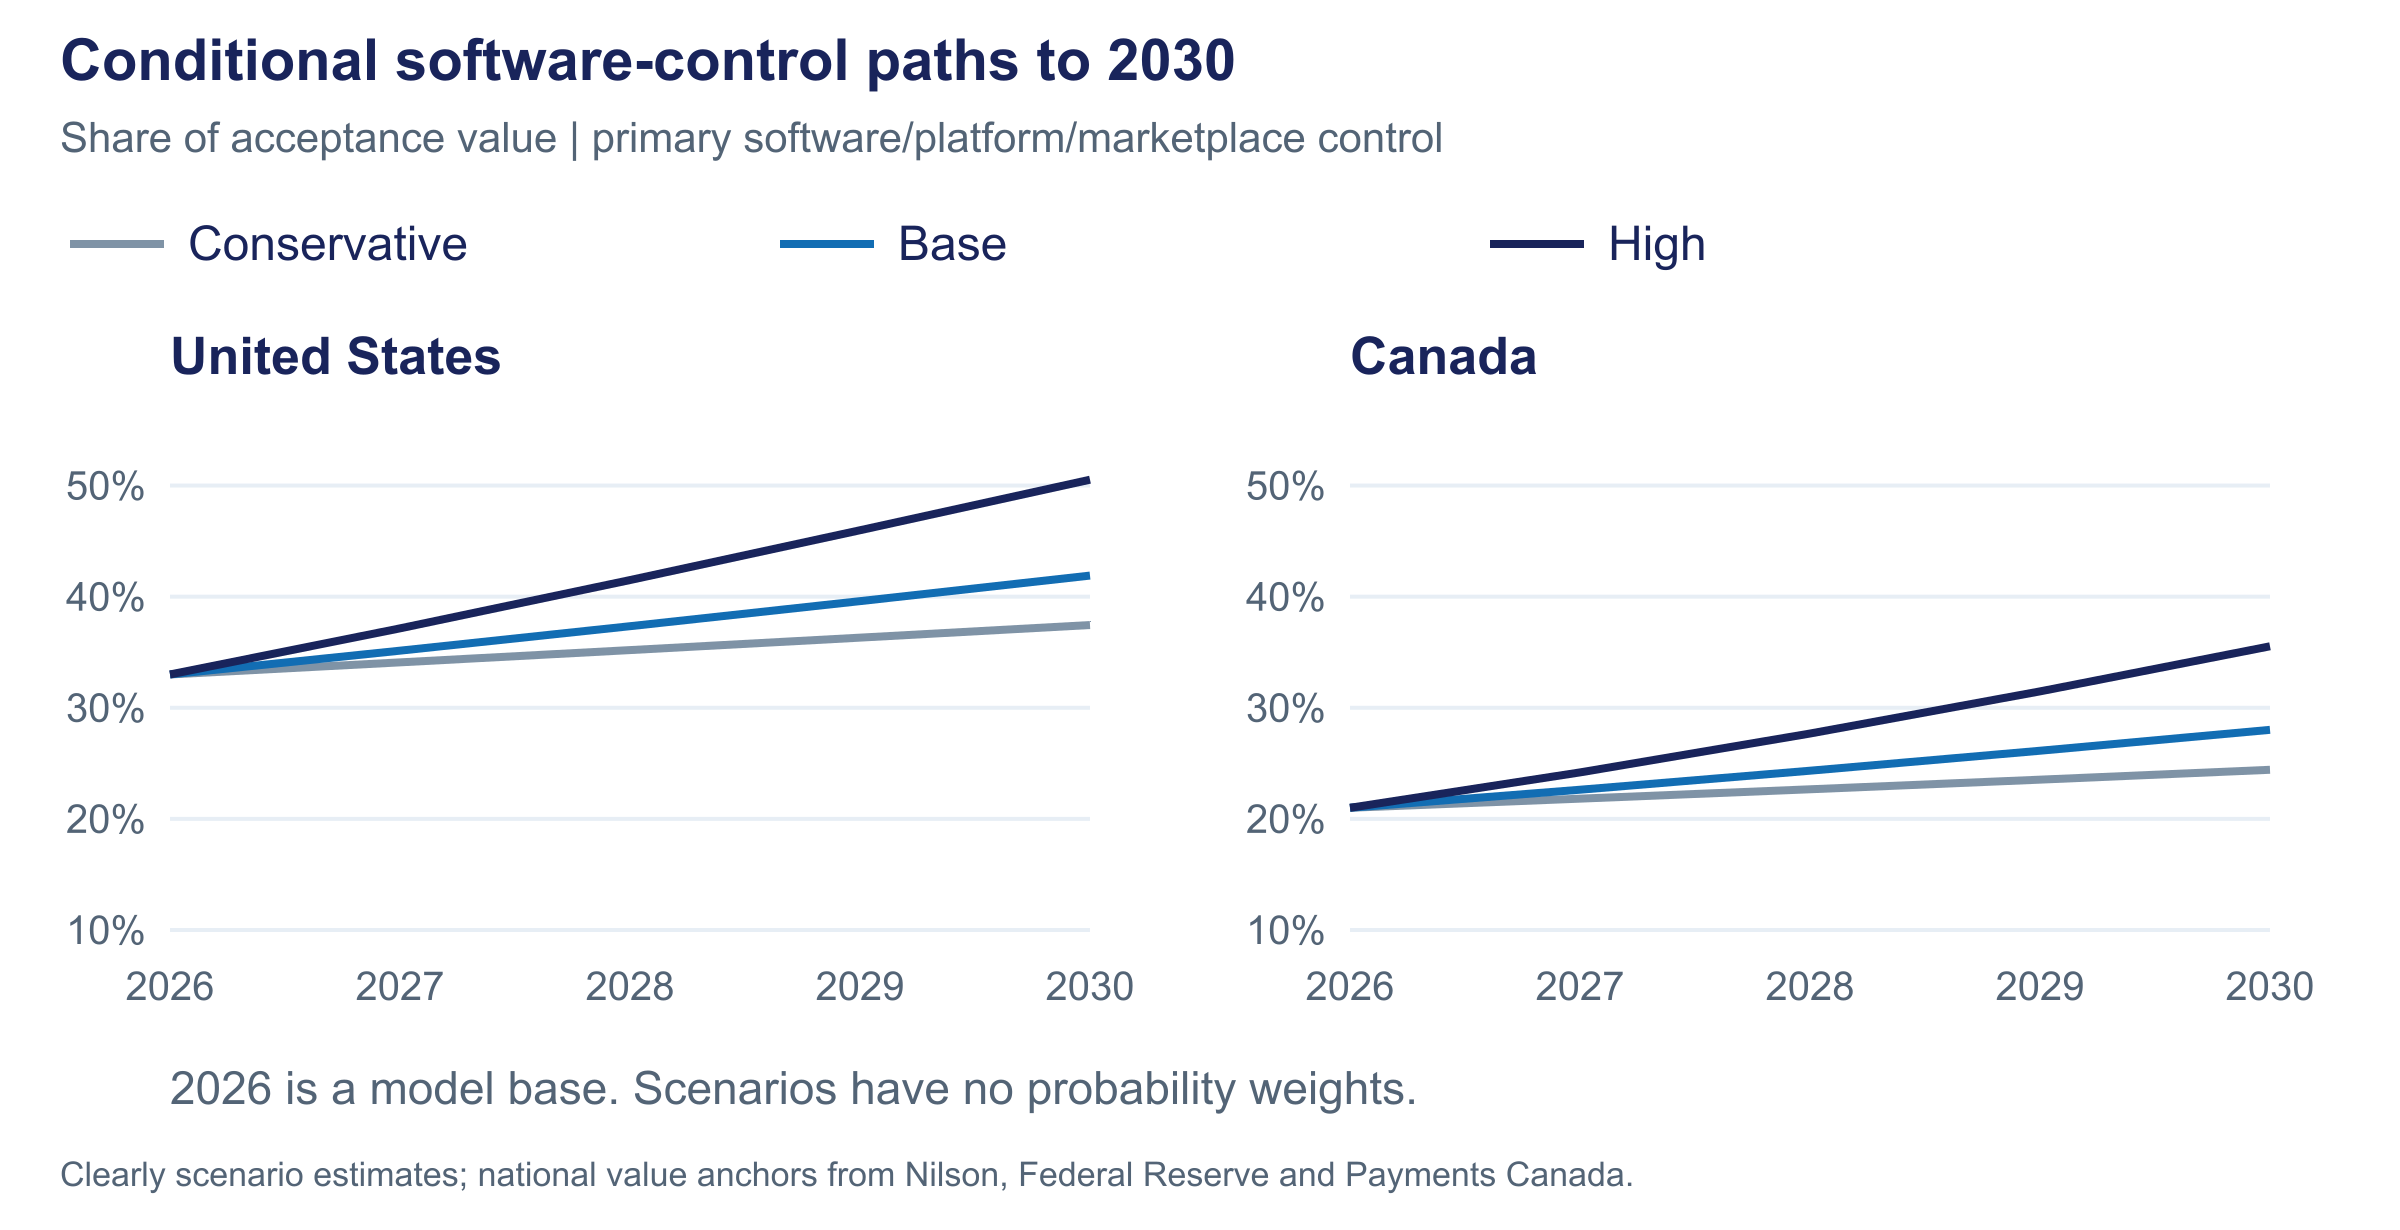
These are Clearly Payments Research estimates. Current shares describe the 2026 market structure using 2025 payment activity. Software-led distribution includes ISV/SaaS, PayFac/platform and marketplace control. The combined market is weighted by payment value.
The category includes independent software vendors, SaaS platforms, payment facilitators and marketplaces that influence the merchant’s acceptance choice. A wallet button alone does not establish control of the underlying relationship.
Software providers have an advantage because they reach merchants when they are choosing how to run their business. Payment acceptance can be sold with reconciliation, reporting and industry-specific workflow. That can make a provider harder to replace than a standalone processing contract.
Established acquirers risk losing direct contact with merchants even while continuing to process their payments. Their response can include deeper software partnerships, ownership of distribution assets and better tools for platforms. Owning the payment rails is only one route to defending the relationship.
Acquiring revenue pools
Retained acquiring revenue is estimated at C$3.6 billion (C$2.5–5 billion) in Canada and US$46 billion (US$35–60 billion) in the United States. This is the revenue left for acceptance businesses after interchange and network charges.
It includes payment-related fees retained by acquiring and distribution partners. The same revenue is counted once before it is shared among them. Separately charged software, hardware and lending are outside the estimate.
| Market | Estimated annual retained acquiring revenue |
|---|---|
| Canada | C$3.6 billion (C$2.5–5 billion) |
| United States | US$46 billion (US$35–60 billion) |
Clearly Payments Research estimates for 2025. Retained acquiring revenue excludes interchange and network charges. It is counted once before operating costs and revenue sharing among acquiring and distribution partners.
Volume leadership and revenue leadership can differ. A large enterprise portfolio may process substantial value at a low retained rate. A software-controlled portfolio can process less value while retaining more revenue per dollar because payment acceptance is integrated into a wider service.
In the central U.S. estimate, software/platform-controlled acceptance accounts for roughly one third of purchase value and just over half of retained acquiring revenue. This is an estimate of the acceptance revenue mix, not a profit allocation. Support costs, partner payments and losses determine what remains as earnings.
Merchants should compare the full cost of payments and software with the value they receive in running their business. Providers need to weigh retained revenue alongside transaction volume.
Consolidation and M&A
Acquisitions can transform a ranking without increasing national merchant spending. The recent Global Payments / Worldpay combination is the clearest example. Global Payments completed the acquisition in January 2026, bringing two large portfolios under one parent. Global Payments’ Worldpay transaction information.
Clearly Payments Research estimates Worldpay represents approximately 70% (65%–75%) of the combined group’s current U.S. acquiring value. With national purchase value held constant, the combination raises the estimated top-three share by approximately seven percentage points (estimated range: six to seven). That increase comes from bringing existing portfolios under the same owner, rather than organic growth.
Canada’s TD/Fiserv transaction works differently. The agreement transferred selected merchant group contracts covering approximately 30,000 locations. TD retained other merchant relationships while adopting Fiserv technology for its offering. The transferred portfolio and the remaining TD business should therefore be counted separately in Canada. TD’s Fiserv agreement.
Moneris adds a third pattern: a proposed change in ownership with bank referrals continuing. The three transactions affect concentration and distribution in different ways. An ownership sale, a portfolio transfer and a software partnership should not all be treated as the same kind of consolidation.
The effect of future deals will depend on which merchant books are combined and which distribution rights move with them. Transaction value alone does not answer either question.
Where smaller acquirers can still compete
A concentrated market does not eliminate room for specialists. It raises the importance of solving a merchant problem that a large generalist cannot address as well.
Industry-specific software is one route. A provider serving field services or professional practices can integrate payment collection with deposits, invoicing and reconciliation. The advantage comes from fitting the workflow, rather than offering another payment terminal.
Implementation and service offer another route. Multi-location merchants may need reporting across systems, complex settlement or a carefully managed transition. A smaller provider can compete where the work requires attention that standard onboarding does not provide.
Specialist underwriting can also matter, particularly where delivery times or refund exposure complicate acceptance. It requires suitable sponsor support and disciplined risk management. Accepting more risk without pricing or controlling it is not a competitive advantage.
A specialist needs to solve a clear merchant problem, deliver the service consistently and retain enough revenue to make the business attractive. Evidence that merchants will stay and pay for that service matters more than broad payment-market growth.
Merchant acquiring outlook for 2030
The base case reaches approximately US$16 trillion of U.S. merchant card purchase value and C$1.5 trillion in Canada by 2030. Software- and platform-led distribution rises to approximately 42% in the U.S. and 28% in Canada.
Three scenarios show how slower payment growth or faster software adoption could change that result. The high case combines stronger nominal purchase growth with software and platforms taking more control of merchant relationships.
| 2030 measure | Conservative | Clearly base case | High growth and software shift |
|---|---|---|---|
| U.S. merchant card purchase value | US$14.5 trillion | US$16.0 trillion | US$17.1 trillion |
| U.S. software/platform-led share | Approximately 37% | Approximately 42% | Approximately 51% |
| U.S. top-five acquiring share | Approximately 73% | Approximately 70% | Approximately 60% |
| Canada merchant card purchase value | C$1.4 trillion | C$1.5 trillion | C$1.6 trillion |
| Canada software/platform-led share | Approximately 24% | Approximately 28% | Approximately 36% |
| Canada top-five acquiring share | Approximately 83% | Approximately 80% | Approximately 72% |
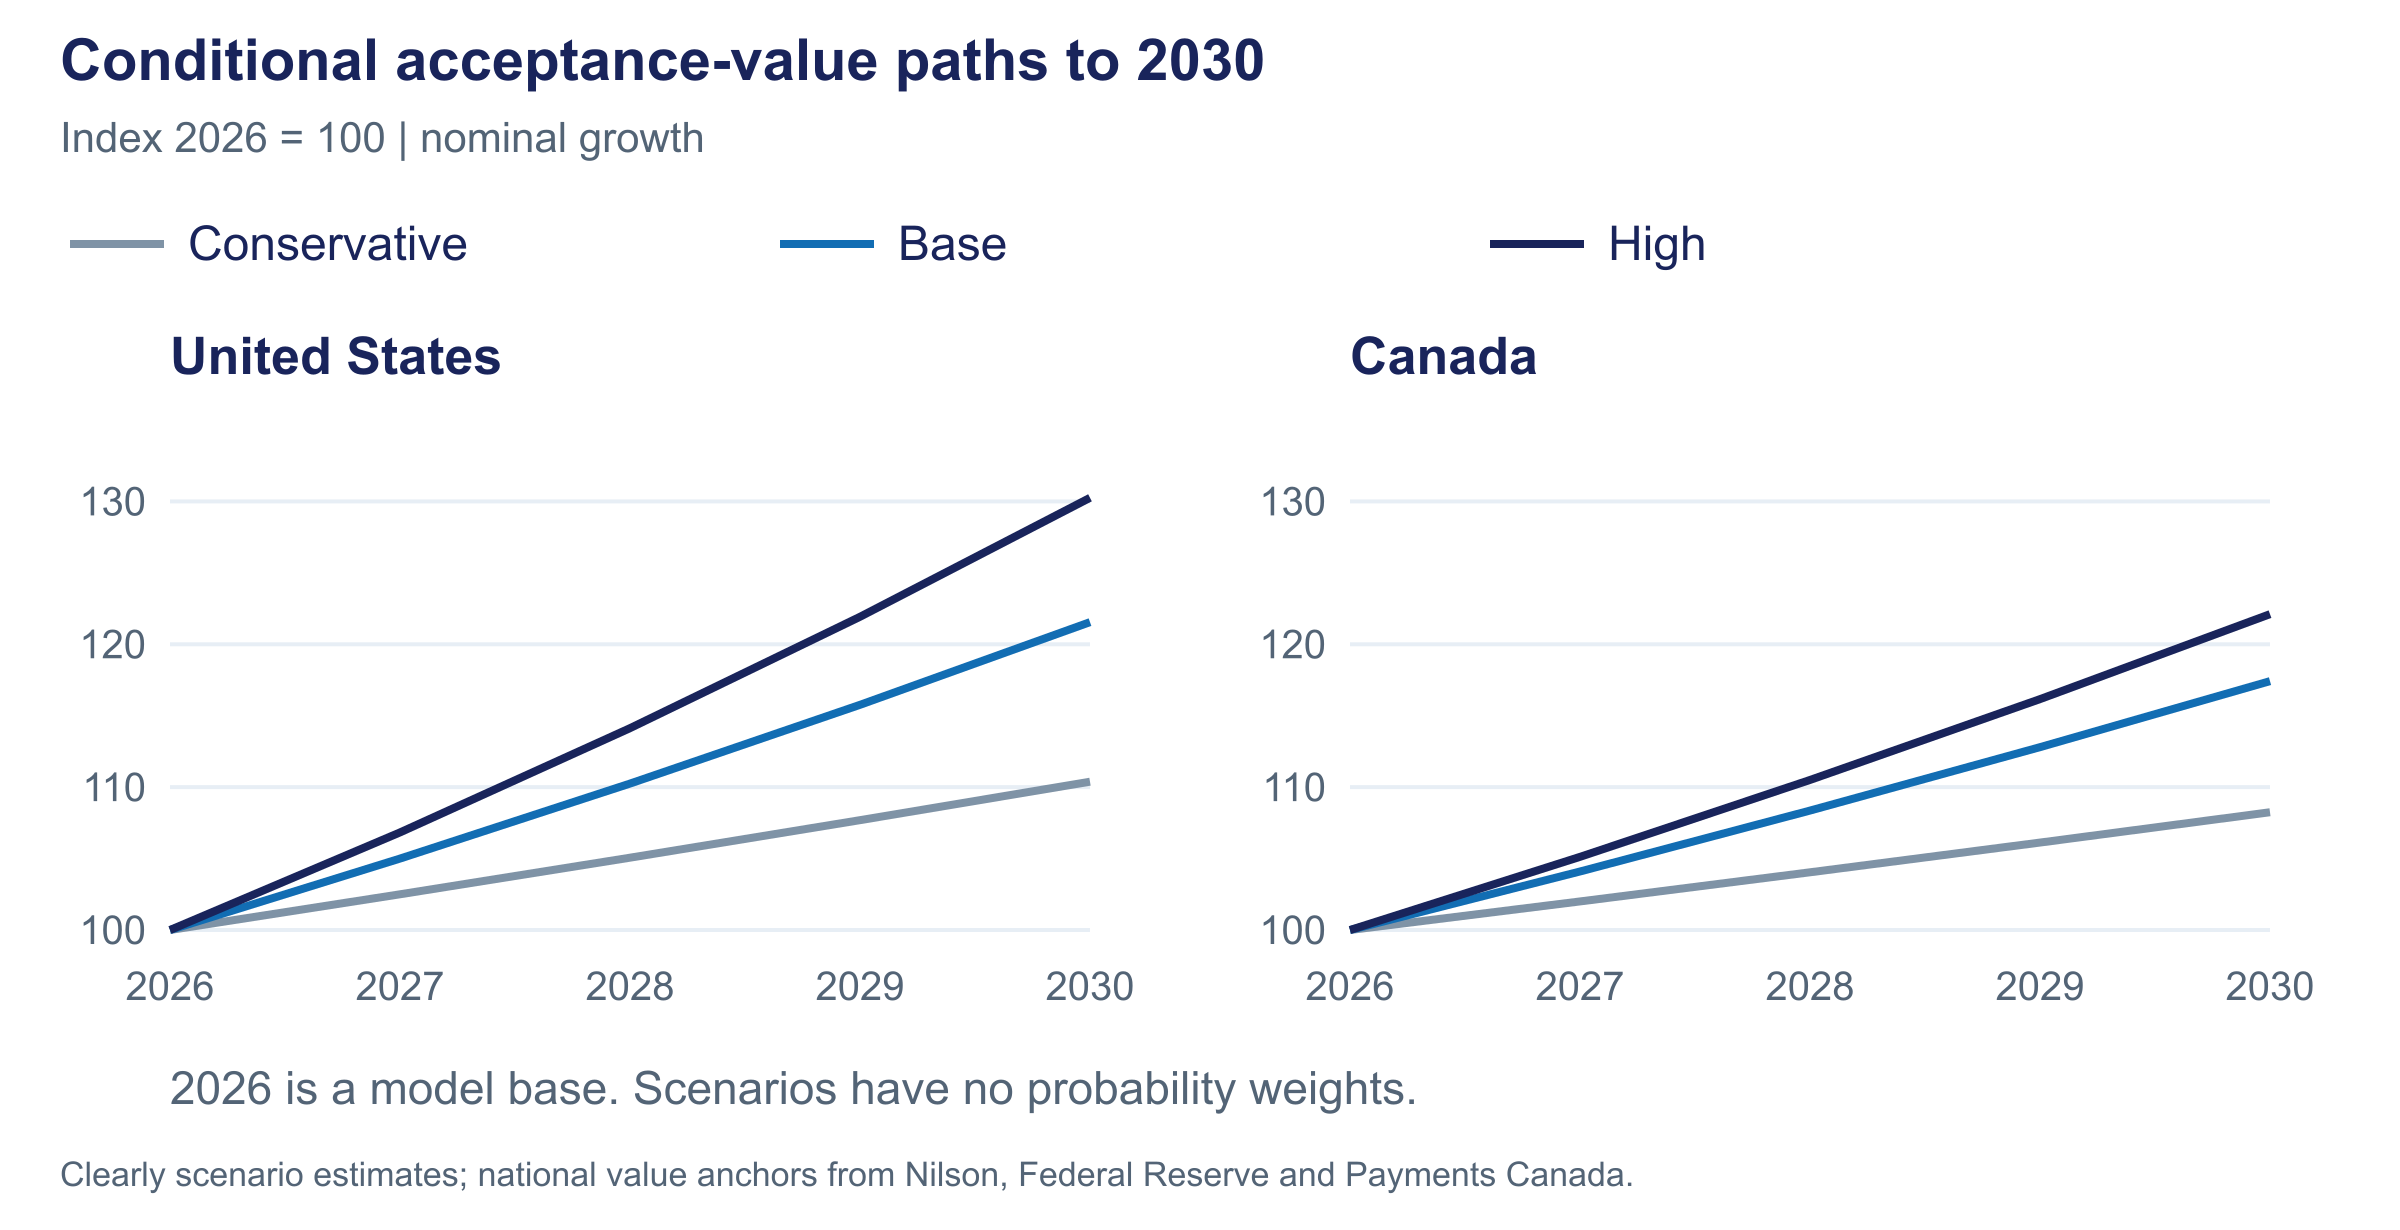
Clearly Payments Research scenarios, rounded. Values are nominal and shown in each country’s currency. The scenarios assume different rates of payment growth and software adoption. They do not assume future acquisitions.
In the base case, the five largest portfolios still hold approximately 70% of U.S. purchase value and 80% in Canada. Software changes how merchants choose payment providers faster than it shifts volume away from the largest acquirers.
Future concentration depends partly on which acquiring portfolios receive software-controlled payment volume. If it stays with the same large portfolios, more software adoption can leave acquiring shares largely intact. A shift to independent providers would reduce those shares. Further acquisitions could offset that effect.
Methodology
Clearly Payments Research combines official payment statistics, company disclosures, public filings, industry data and proprietary normalisation models. Point estimates show the rounded central case; parentheses retain the estimated range where direct market data is incomplete or definitions differ.
The 2026 edition primarily measures 2025 payment activity. Provider comparisons reflect the 2026 ownership structure. Canadian market value includes merchant credit, debit and prepaid purchases, including online purchases. U.S. estimates start with purchases on U.S.-issued cards, then allow for the difference between the cardholder’s country and the merchant’s country.
Market share refers to merchant card purchase value assigned to a commercial acceptance portfolio. Gateway-only traffic and upstream processing are not added as separate acquiring value. Software distribution is measured separately from portfolio ownership. Provider-level ranges should not be added at their low or high endpoints.
Sourced statistics are attributed to their publisher. Calculations use arithmetic applied to published inputs. Estimates include modelled country shares, revenue pools and distribution shares. The 2030 figures are scenarios rather than observed outcomes or probability forecasts.
Frequently asked questions
Who is the largest merchant acquirer in Canada?
Moneris has the largest estimated Canadian acquiring portfolio. Its estimated share is 33% (29%–36%) of merchant card purchase value. Global Payments / Worldpay and Chase follow.
How concentrated is Canada’s payment processing market?
The largest three commercial acquiring portfolios hold an estimated 73% (65%–80%) of Canadian merchant card purchase value. The largest five hold 84% (75%–92%). These figures concern acquiring portfolios, rather than every processor or gateway touching a transaction.
How many meaningful merchant acquirers operate in Canada?
An estimated 14 (12–18) commercial provider families exceed C$1 billion in annual Canadian volume. There are additional brands and distributors, some of which share an underlying acquiring portfolio.
Who are the largest merchant acquirers in the U.S.?
Global Payments / Worldpay, Fiserv and JPMorgan Chase form the leading U.S. tier. TSG’s current-parent ranking places Global Payments / Worldpay first. Nilson’s 2025 merchant-acquirer ranking names Fiserv first.
What is the difference between an acquirer and a payment processor?
An acquirer provides the merchant’s card-acceptance relationship and associated network responsibilities. A processor performs technical functions such as authorization, clearing and settlement. A company can perform both roles, while a software platform or distributor can control the merchant relationship.
Is Moneris being acquired?
As of 27 October 2026, Francisco Partners’ proposed acquisition of Moneris from BMO and RBC remains pending. The announced agreement expects closing by the end of the banks’ first fiscal quarter of 2027, subject to approvals and other closing conditions. Moneris transaction announcement.
Sources
The principal external sources for this report are listed below.
- Payments Canada: CPMT 2026, Table 5 p32, Figure A7 p84, A9 p85, methodology pp87-89
- Nilson Report: 2025 U.S.-issued card purchases US$12.498T, 5.0% growth
- Moneris: Acquisition announcement: current 325,000 points, one in three transactions, exclusive bank referrals
- Bank of Canada staff research: Welte and Molnar, acquiring market structure, historical shares, banking relationships and fees
- Global Payments: Desjardins portfolio of about 40,000 merchants and ten-year referral alliance
- TD Bank Group: Selected merchant group contracts transferred; retained merchant offering
- Fiserv: Company-disclosed 2025 U.S. merchant transaction volume US$2.6T
- Fiserv: Named top US merchant acquirer by Nilson
- TSG: Public U.S. provider volumes and historical Worldpay scale
- TSG: 2026 directory public summary
- Global Payments: Worldpay completion and corporate profile
- Bank of Canada: 2025 average exchange rate C$1.3978 per US$1
- National Bank of Canada: Current Clover/Fiserv merchant referral offer for commercial clients
Suggested citation: Clearly Payments Research, Merchant Acquiring Market Share in the U.S. & Canada: 2026 Report, October 27, 2026.