B2B payments remain one of the largest and least consumerized segments of global commerce, but the data in 2026 shows steady, measurable change. Trade credit terms like Net30 and Net60 still dominate invoice-based payments, while digital methods, including credit cards, are growing faster than any other rail. The result is a hybrid environment where legacy practices persist, but behavior is increasingly shaped by speed, automation, and working-capital optimization.
This article focuses specifically on what the data says, not opinions, about how B2B payments are actually made in 2026.
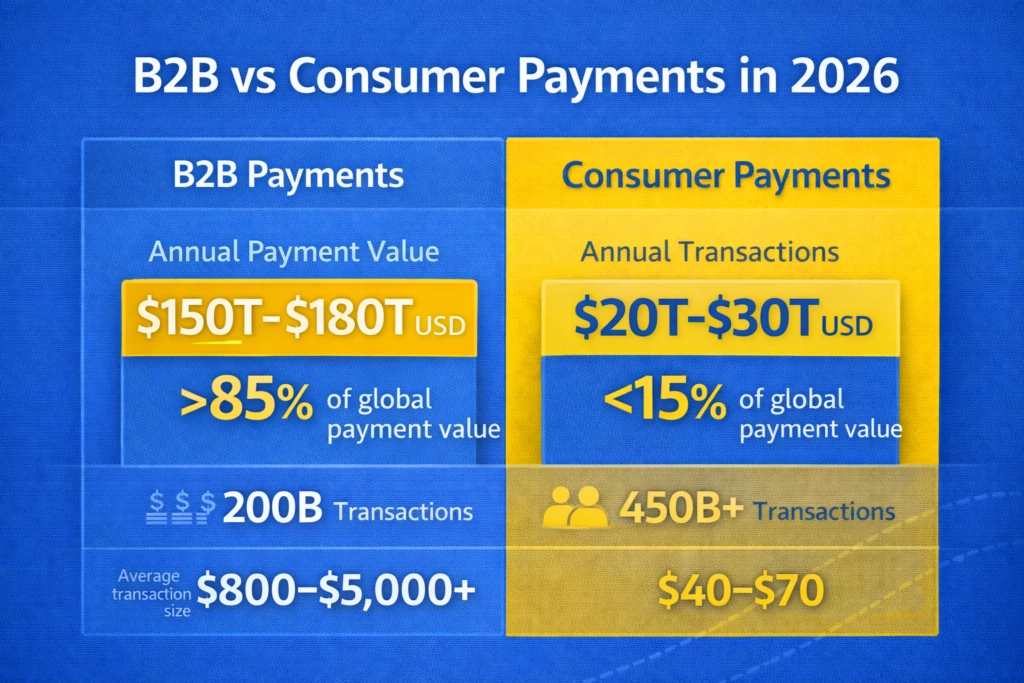
Global B2B Payments Market Size and Growth
The global B2B payments market continues to dwarf consumer payments by value. In 2026, total annual B2B payment volume is estimated at $150T–$180T USD, representing over 85% of global payment value, driven by wholesale trade, manufacturing, professional services, and cross-border commerce. By comparison, consumer payments total roughly $20T–$30T USD annually, despite accounting for the majority of payment transactions worldwide.
Several structural data points stand out:
- B2B payments represent over 85% of total global payment value, despite being fewer in transaction count than consumer payments
- North America accounts for approximately 30–35% of global B2B payment value
- Cross-border B2B payments grow at 6–8% CAGR, faster than domestic B2B volumes
Despite this scale, modernization is uneven, which is why payment mix statistics matter.
Net30 and Net60 Usage by the Numbers
Trade credit remains the backbone of B2B payments. In 2026, Net30 and Net60 are still the most commonly offered invoice terms across North America and Europe.
Data across multiple industry surveys shows:
- Net30 is offered on ~55–65% of B2B invoices in North America
- Net60 appears on ~15–25% of invoices, most commonly for enterprise buyers
- Net90 remains below 10% outside of government, construction, and large manufacturing contracts
Payment behavior diverges meaningfully from invoice terms:
- Only 52–58% of Net30 invoices are paid on time
- 20–25% are paid 1–30 days late
- 10–15% exceed 30 days past due, materially impacting cash flow
These statistics explain why suppliers increasingly seek faster or guaranteed settlement options alongside trade credit.
Days Sales Outstanding (DSO) Benchmarks
Days Sales Outstanding (DSO), which measures the average number of days it takes a business to collect payment after a sale, remains one of the most closely tracked B2B finance metrics, and the data in 2026 shows persistent inefficiencies.
Median DSO benchmarks by segment:
- SMBs: 38–45 days
- Mid-market: 45–55 days
- Enterprise: 55–65 days
Industries with the highest DSOs include construction, manufacturing, logistics, and professional services. Businesses that rely exclusively on invoice-based Net Terms typically report DSOs 12–18 days higher than peers offering digital payment alternatives, including cards.
Digital Adoption in B2B Payments
Digital payment adoption continues to rise, but legacy rails remain significant. In 2026, the shift is best described as incremental but durable.
Key adoption statistics:
- 65–70% of B2B invoices are now issued electronically
- 45–50% of B2B payments are initiated digitally, including ACH/EFT, wire, and cards
- Checks still account for ~30–35% of B2B payments by count in North America, but less than 15% by value
Automation impacts efficiency materially:
- Automated invoicing reduces invoice processing costs by 60–80%
- Digital reconciliation cuts close time by 30–50%
- Businesses using ERP-connected payment workflows report 20–25% faster invoice-to-cash cycles
Credit Card Usage in B2B Payments
Credit cards remain underutilized relative to their advantages, but adoption continues to climb. In 2026, cards account for approximately 8–12% of B2B payment volume, but 20–25% of transaction count, skewed toward smaller and recurring payments.
Usage patterns show clear trends:
- Cards are used in over 40% of B2B SaaS, IT services, and digital marketing payments
- 30–35% of SMB suppliers accept cards, compared to over 70% acceptance in B2C
- Average B2B card transaction size ranges from $2,500 to $7,000, depending on industry
For buyers, cards function as embedded credit:
- Effective payment float of 20–55 days, depending on billing cycle
- Rewards and rebates averaging 1–2%, often exceeding early-pay discounts
For suppliers, the financial impact is measurable:
- Card acceptance reduces DSO by 10–20 days
- Guaranteed settlement within 1–2 business days
- Fraud and non-payment risk shifts to card networks
Net Terms vs Credit Cards: Comparative Data
Rather than competing directly, Net Terms and cards increasingly coexist. Data shows buyers choose based on transaction size, urgency, and internal approval workflows.
Comparative statistics:
- Invoices over $25,000 are paid via Net Terms more than 80% of the time
- Transactions under $10,000 are paid by card in 35–45% of cases when offered
- Offering card payments alongside invoicing increases on-time payment rates by 15–25%
Suppliers offering both options report:
- Lower collection costs
- Higher customer satisfaction
- More predictable cash flow
What the Data Signals for 2026 and Beyond
The statistics point to a clear conclusion. B2B payments are not abandoning Net30 or Net60, but they are becoming more flexible, data-driven, and digitally optimized.
Businesses winning in 2026:
- Combine trade credit with digital rails
- Use cards strategically to reduce DSO
- Automate invoicing and reconciliation
- Treat payments as a working-capital lever, not just back-office plumbing
Get Started with B2B Clearly Payments
- Wide range of supported industries
- Fast funding
- A full set of payment products to accept payment anytime, anywhere
- World-class customer service